19、Kubernetes - 实战:k8s之日志收集
一、k8s日志收集方案
1.在node上部署一个日志收集程序
DaemonSet方式部署日志收集程序对本节点的/var/log和/var/lib/docker/containers下的日志进行采集:
优点:配置简单、后期维护简单
缺点:日志类型不好分类
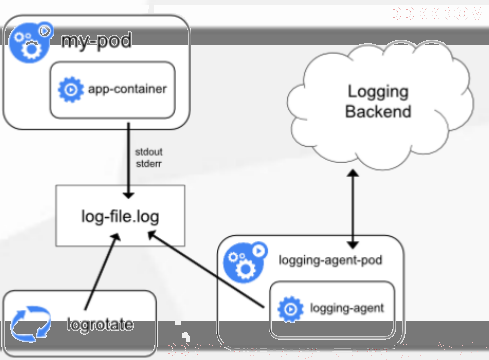
2.在pod中附加专用日志收集容器
每个运行应用程序的pod中增加一个日志收集容器,使用emptyDir共享日志目录让日志收集容器读取到日志数据
优点:低耦合、可以更好的对日志进行分类
缺点:每个pod启动一个日志收集代理,增加资源消耗,并增加运维维护成本
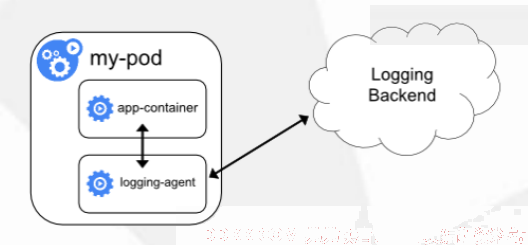
3.和第二种方案有点类似,但是在一个pod同一个容器中启动日志收集程序
每个运行应用程序的同一个容器中增加一个日志收集进程,先运行日志收集程序,在运行业务程序
优点:更简单、可以对日志类型更好的分类,无需使用共享存储
缺点:每个pod启动一个日志收集代理,增加资源消耗,并增加运维维护成本,对业务容器有一定侵入性,需要在业务容器中运行日志收集进程

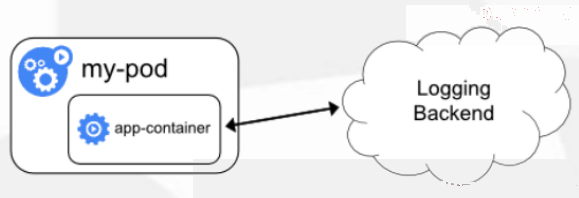
4.应用程序直接推送日志
应用程序直接将日志推送到日志收集系统中
优点:无需运维介入,减少后期运维成本
缺点:对代码有一定侵入性
下面我们就用第二种方案来实践日志收集:
二、部署ELK日志收集系统
1、集群环境
OS:
root@harbor:~# cat /etc/issue
Ubuntu 20.04.2 LTS \n \l

IP分配:
192.168.88.100 k8s-deploy
192.168.88.101 k8s-master etcd
192.168.88.102 k8s-node1
192.168.88.103 k8s-node2

192.168.88.111 es-node1
192.168.88.112 es-node2
192.168.88.113 es-node2
192.168.88.114 logstash

192.168.88.121 kafka-node1
192.168.88.122 kafka-node2
192.168.88.123 kafka-node3
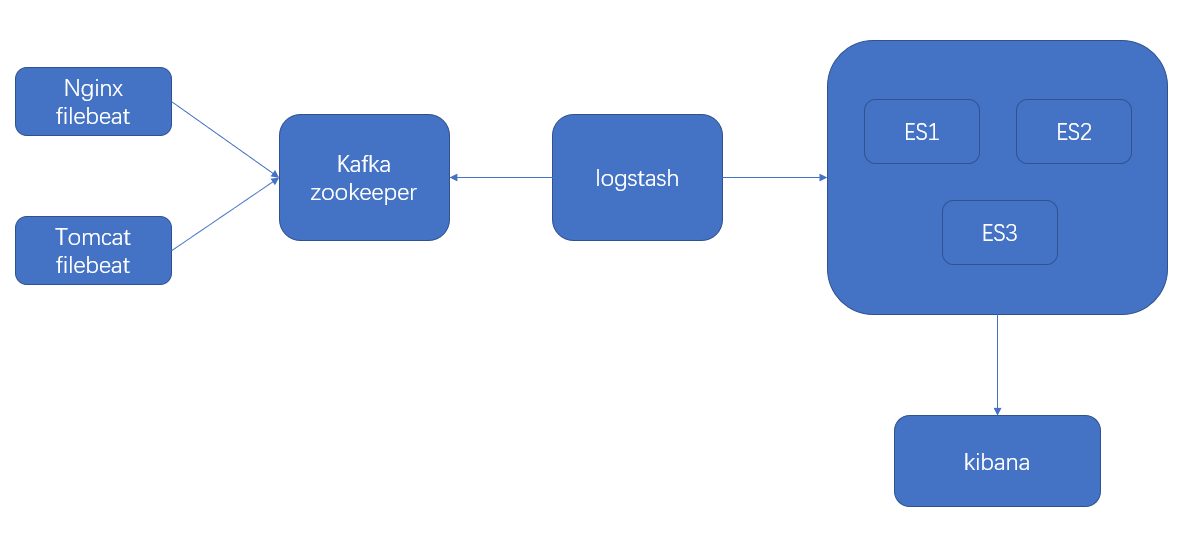
2、ELK架构图
3、部署es集群
下载安装elasticsearch 7.6.2 (地址:https://www.elastic.co/cn/downloads/past-releases#elasticsearch)
# 在es所有节点上执行 dpkg -i elasticsearch-7.6.2-amd64.deb
root@es-node1:~# dpkg -i elasticsearch-7.6.2-amd64.deb
Selecting previously unselected package elasticsearch.
(Reading database ... 71582 files and directories currently installed.)
Preparing to unpack elasticsearch-7.6.2-amd64.deb ...
Creating elasticsearch group... OK
Creating elasticsearch user... OK
Unpacking elasticsearch (7.6.2) ...
Setting up elasticsearch (7.6.2) ...
Created elasticsearch keystore in /etc/elasticsearch
Processing triggers for systemd (245.4-4ubuntu3.11) ...
elasticsearch.yml
# ======================== Elasticsearch Configuration =========================
#
# NOTE: Elasticsearch comes with reasonable defaults for most settings.
#       Before you set out to tweak and tune the configuration, make sure you
#       understand what are you trying to accomplish and the consequences.
#
# The primary way of configuring a node is via this file. This template lists
# the most important settings you may want to configure for a production cluster.
#
# Please consult the documentation for further information on configuration options:
# https://www.elastic.co/guide/en/elasticsearch/reference/index.html
#
# ---------------------------------- Cluster -----------------------------------
#
# Use a descriptive name for your cluster:
#
cluster.name: zhrx-elk-cluster
#
# ------------------------------------ Node ------------------------------------
#
# Use a descriptive name for the node:
#
node.name: node1   配置node节点名称
#
# Add custom attributes to the node:
#
#node.attr.rack: r1
#
# ----------------------------------- Paths ------------------------------------
#
# Path to directory where to store the data (separate multiple locations by comma):
#
path.data: /var/lib/elasticsearch
#
# Path to log files:
#
path.logs: /var/log/elasticsearch
#
# ----------------------------------- Memory -----------------------------------
#
# Lock the memory on startup:
#
#bootstrap.memory_lock: true
#
# Make sure that the heap size is set to about half the memory available
# on the system and that the owner of the process is allowed to use this
# limit.
#
# Elasticsearch performs poorly when the system is swapping the memory.
#
# ---------------------------------- Network -----------------------------------
#
# Set the bind address to a specific IP (IPv4 or IPv6):
#
network.host: 192.168.88.111   配置node节点网络监听地址
#
# Set a custom port for HTTP:
#
http.port: 9200
#
# For more information, consult the network module documentation.
#
# --------------------------------- Discovery ----------------------------------
#
# Pass an initial list of hosts to perform discovery when this node is started:
# The default list of hosts is ["127.0.0.1", "[::1]"]
#
discovery.seed_hosts: ["192.168.88.111", "192.168.88.112", "192.168.88.113"]
#
# Bootstrap the cluster using an initial set of master-eligible nodes:
#
cluster.initial_master_nodes: ["192.168.88.111", "192.168.88.112", "192.168.88.113"]
#
# For more information, consult the discovery and cluster formation module documentation.
#
# ---------------------------------- Gateway -----------------------------------
#
# Block initial recovery after a full cluster restart until N nodes are started:
#
gateway.recover_after_nodes: 2
#
# For more information, consult the gateway module documentation.
#
# ---------------------------------- Various -----------------------------------
#
# Require explicit names when deleting indices:
#
action.destructive_requires_name: true
启动es
root@es-node1:~# systemctl start elasticsearch
root@es-node2:~# systemctl start elasticsearch
root@es-node3:~# systemctl start elasticsearch

# 查看es服务状态
root@es-node1:~# systemctl status elasticsearch
● elasticsearch.service - Elasticsearch
     Loaded: loaded (/lib/systemd/system/elasticsearch.service; disabled; vendor preset: enabled)
     Active: active (running) since Mon 2022-02-28 14:57:38 CST; 54s ago
       Docs: http://www.elastic.co
   Main PID: 3847 (java)
      Tasks: 40 (limit: 1071)
     Memory: 759.2M
     CGroup: /system.slice/elasticsearch.service
             ├─3847 /usr/share/elasticsearch/jdk/bin/java -Des.networkaddress.cache.ttl=60 -Des.networkaddress.cache.negative.ttl=10 -XX:+AlwaysPreTouch -Xss1m -Djava.awt.headless=true -Dfile.encoding=UTF-8 ->
             └─3932 /usr/share/elasticsearch/modules/x-pack-ml/platform/linux-x86_64/bin/controller

Feb 28 14:57:13 es-node1 systemd[1]: Starting Elasticsearch...
Feb 28 14:57:13 es-node1 elasticsearch[3847]: OpenJDK 64-Bit Server VM warning: Option UseConcMarkSweepGC was deprecated in version 9.0 and will likely be removed in a future release.
Feb 28 14:57:38 es-node1 systemd[1]: Started Elasticsearch.

# es监听端口
root@es-node1:~# netstat -tnlp | grep -E "9200|9300"
tcp6       0      0 192.168.88.111:9200     :::*                    LISTEN      3847/java
tcp6       0      0 192.168.88.111:9300     :::*                    LISTEN      3847/java

# 获取es集群状态
root@es-node1:~# curl http://192.168.88.111:9200
{
  "name" : "node1",
  "cluster_name" : "zhrx-elk-cluster",
  "cluster_uuid" : "jwcBNwVnTpmdaxr2-pIJ-A",
  "version" : {
    "number" : "7.6.2",
    "build_flavor" : "default",
    "build_type" : "deb",
    "build_hash" : "ef48eb35cf30adf4db14086e8aabd07ef6fb113f",
    "build_date" : "2020-03-26T06:34:37.794943Z",
    "build_snapshot" : false,
    "lucene_version" : "8.4.0",
    "minimum_wire_compatibility_version" : "6.8.0",
    "minimum_index_compatibility_version" : "6.0.0-beta1"
  },
  "tagline" : "You Know, for Search"
}
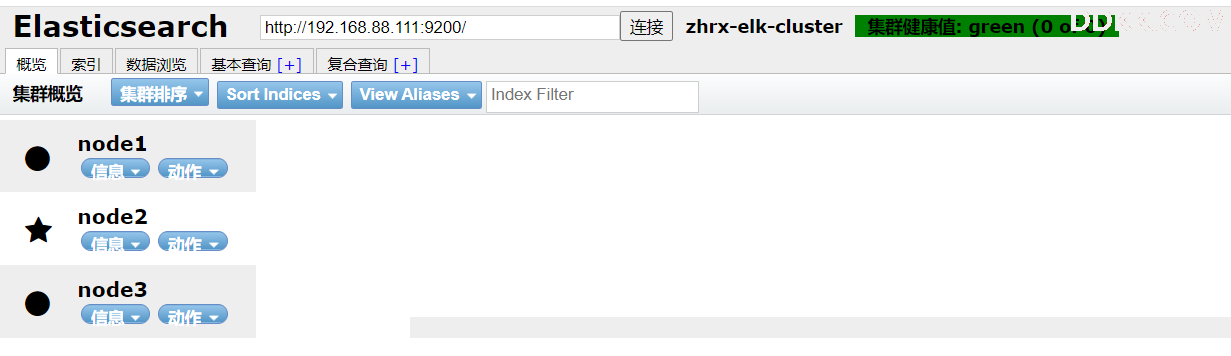
通过elasticsearch head插件访问es集群
4、部署kafka集群
4.1、部署zookeeper
安装jdk
root@kafka-node1:~# apt install openjdk-8-jdk -y
root@kafka-node2:~# apt install openjdk-8-jdk -y
root@kafka-node3:~# apt install openjdk-8-jdk -y

root@kafka-node1:~# java -version
openjdk version "1.8.0_312"
OpenJDK Runtime Environment (build 1.8.0_312-8u312-b07-0ubuntu1~20.04-b07)
OpenJDK 64-Bit Server VM (build 25.312-b07, mixed mode)
安装zookeeper,下载地址:https://dlcdn.apache.org/zookeeper/zookeeper-3.5.9/apache-zookeeper-3.5.9-bin.tar.gz
# 在所有kafka节点上以下操作
root@kafka-node1:~# mkdir /apps
root@kafka-node1:~# mv apache-zookeeper-3.5.9-bin.tar.gz /apps/
root@kafka-node1:~# cd /apps/
root@kafka-node1:/apps# tar xf apache-zookeeper-3.5.9-bin.tar.gz
root@kafka-node1:/apps# ln -sv apache-zookeeper-3.5.9-bin zookeeper
'zookeeper' -> 'apache-zookeeper-3.5.9-bin'

# 创建数据目录
root@kafka-node1:/apps# mkdir -p /data/zookeeper
root@kafka-node2:/apps# mkdir -p /data/zookeeper
root@kafka-node3:/apps# mkdir -p /data/zookeeper

# 创建id文件
root@kafka-node1:/apps# echo 1 > /data/zookeeper/myid
root@kafka-node2:/apps# echo 2 > /data/zookeeper/myid
root@kafka-node3:/apps# echo 3 > /data/zookeeper/myid
zookeeper配置文件/apps/zookeeper/conf/zoo.cfg,拷贝到所有kafka节点上并修改相应配置
# The number of milliseconds of each tick
tickTime=2000
# The number of ticks that the initial
# synchronization phase can take
initLimit=10
# The number of ticks that can pass between
# sending a request and getting an acknowledgement
syncLimit=5
# the directory where the snapshot is stored.
# do not use /tmp for storage, /tmp here is just
# example sakes.
dataDir=/data/zookeeper
# the port at which the clients will connect
clientPort=2181
# the maximum number of client connections.
# increase this if you need to handle more clients
maxClientCnxns=60
#
# Be sure to read the maintenance section of the
# administrator guide before turning on autopurge.
#
# http://zookeeper.apache.org/doc/current/zookeeperAdmin.html#sc_maintenance
#
# The number of snapshots to retain in dataDir
autopurge.snapRetainCount=3
# Purge task interval in hours
# Set to "0" to disable auto purge feature
autopurge.purgeInterval=1

server.1=192.168.88.121:2888:3888
server.2=192.168.88.122:2888:3888
server.3=192.168.88.123:2888:3888
启动zookeeper集群
# 在所有节点上启动zookeeper
root@kafka-node1:/apps/zookeeper# ./bin/zkServer.sh start
/usr/bin/java
ZooKeeper JMX enabled by default
Using config: /apps/zookeeper/bin/../conf/zoo.cfg
Starting zookeeper ... STARTED

# 查看集群状态
root@kafka-node1:/apps/zookeeper# ./bin/zkServer.sh status
/usr/bin/java
ZooKeeper JMX enabled by default
Using config: /apps/zookeeper/bin/../conf/zoo.cfg
Client port found: 2181. Client address: localhost. Client SSL: false.
Mode: follower
zookeeper集群安装完成
4.2、部署kafka
安装kafka集群,下载地址:https://archive.apache.org/dist/kafka/2.4.1/kafka_2.13-2.4.1.tgz
# 接下kafka二进制包,在所有节点上执行
root@kafka-node1:~# mv kafka_2.13-2.4.1.tgz /apps/
root@kafka-node1:~# cd /apps/
root@kafka-node1:/apps# tar xf kafka_2.13-2.4.1.tgz
root@kafka-node1:/apps# ln -sv kafka_2.13-2.4.1 kafka
'kafka' -> 'kafka_2.13-2.4.1'

# 创建数据目录
root@kafka-node1:/apps/kafka# mkdir -p /data/kafka-logs
root@kafka-node2:/apps/kafka# mkdir -p /data/kafka-logs
root@kafka-node3:/apps/kafka# mkdir -p /data/kafka-logs
kafka配置文件/data/kafka/config/server.properties,拷贝到其他两个节点上并修改相应的配置
# Licensed to the Apache Software Foundation (ASF) under one or more
# contributor license agreements.  See the NOTICE file distributed with
# this work for additional information regarding copyright ownership.
# The ASF licenses this file to You under the Apache License, Version 2.0
# (the "License"); you may not use this file except in compliance with
# the License.  You may obtain a copy of the License at
#
#    http://www.apache.org/licenses/LICENSE-2.0
#
# Unless required by applicable law or agreed to in writing, software
# distributed under the License is distributed on an "AS IS" BASIS,
# WITHOUT WARRANTIES OR CONDITIONS OF ANY KIND, either express or implied.
# See the License for the specific language governing permissions and
# limitations under the License.

# see kafka.server.KafkaConfig for additional details and defaults

############################# Server Basics########################

# The id of the broker. This must be set to a unique integer for each broker.
broker.id=121    不同节点id不能冲突

############################# Socket Server Settings########################

# The address the socket server listens on. It will get the value returned from
# java.net.InetAddress.getCanonicalHostName() if not configured.
#   FORMAT:
#     listeners = listener_name://host_name:port
#   EXAMPLE:
#     listeners = PLAINTEXT://your.host.name:9092
listeners=PLAINTEXT://192.168.88.121:9092    配置节点监听地址

# Hostname and port the broker will advertise to producers and consumers. If not set,
# it uses the value for "listeners" if configured.  Otherwise, it will use the value
# returned from java.net.InetAddress.getCanonicalHostName().
#advertised.listeners=PLAINTEXT://your.host.name:9092

# Maps listener names to security protocols, the default is for them to be the same. See the config documentation for more details
#listener.security.protocol.map=PLAINTEXT:PLAINTEXT,SSL:SSL,SASL_PLAINTEXT:SASL_PLAINTEXT,SASL_SSL:SASL_SSL

# The number of threads that the server uses for receiving requests from the network and sending responses to the network
num.network.threads=3

# The number of threads that the server uses for processing requests, which may include disk I/O
num.io.threads=8

# The send buffer (SO_SNDBUF) used by the socket server
socket.send.buffer.bytes=102400

# The receive buffer (SO_RCVBUF) used by the socket server
socket.receive.buffer.bytes=102400

# The maximum size of a request that the socket server will accept (protection against OOM)
socket.request.max.bytes=104857600
############################# Log Basics########################

# A comma separated list of directories under which to store log files
log.dirs=/data/kafka-logs    数据目录

# The default number of log partitions per topic. More partitions allow greater
# parallelism for consumption, but this will also result in more files across
# the brokers.
num.partitions=1

# The number of threads per data directory to be used for log recovery at startup and flushing at shutdown.
# This value is recommended to be increased for installations with data dirs located in RAID array.
num.recovery.threads.per.data.dir=1

############################# Internal Topic Settings####################
# The replication factor for the group metadata internal topics "__consumer_offsets" and "__transaction_state"
# For anything other than development testing, a value greater than 1 is recommended to ensure availability such as 3.
offsets.topic.replication.factor=1
transaction.state.log.replication.factor=1
transaction.state.log.min.isr=1

############################# Log Flush Policy########################

# Messages are immediately written to the filesystem but by default we only fsync() to sync
# the OS cache lazily. The following configurations control the flush of data to disk.
# There are a few important trade-offs here:
#    1. Durability: Unflushed data may be lost if you are not using replication.
#    2. Latency: Very large flush intervals may lead to latency spikes when the flush does occur as there will be a lot of data to flush.
#    3. Throughput: The flush is generally the most expensive operation, and a small flush interval may lead to excessive seeks.
# The settings below allow one to configure the flush policy to flush data after a period of time or
# every N messages (or both). This can be done globally and overridden on a per-topic basis.

# The number of messages to accept before forcing a flush of data to disk
#log.flush.interval.messages=10000

# The maximum amount of time a message can sit in a log before we force a flush
#log.flush.interval.ms=1000

############################# Log Retention Policy########################

# The following configurations control the disposal of log segments. The policy can
# be set to delete segments after a period of time, or after a given size has accumulated.
# A segment will be deleted whenever *either* of these criteria are met. Deletion always happens
# from the end of the log.

# The minimum age of a log file to be eligible for deletion due to age
log.retention.hours=168

# A size-based retention policy for logs. Segments are pruned from the log unless the remaining
# segments drop below log.retention.bytes. Functions independently of log.retention.hours.
#log.retention.bytes=1073741824

# The maximum size of a log segment file. When this size is reached a new log segment will be created.
log.segment.bytes=1073741824

# The interval at which log segments are checked to see if they can be deleted according
# to the retention policies
log.retention.check.interval.ms=300000

############################# Zookeeper########################

# Zookeeper connection string (see zookeeper docs for details).
# This is a comma separated host:port pairs, each corresponding to a zk
# server. e.g. "127.0.0.1:3000,127.0.0.1:3001,127.0.0.1:3002".
# You can also append an optional chroot string to the urls to specify the
# root directory for all kafka znodes.
zookeeper.connect=192.168.88.121:2181,192.168.88.122:2181,192.168.88.123:2181     连接zookeeper地址

# Timeout in ms for connecting to zookeeper
zookeeper.connection.timeout.ms=6000
############################# Group Coordinator Settings########################

# The following configuration specifies the time, in milliseconds, that the GroupCoordinator will delay the initial consumer rebalance.
# The rebalance will be further delayed by the value of group.initial.rebalance.delay.ms as new members join the group, up to a maximum of max.poll.interval.ms.
# The default value for this is 3 seconds.
# We override this to 0 here as it makes for a better out-of-the-box experience for development and testing.
# However, in production environments the default value of 3 seconds is more suitable as this will help to avoid unnecessary, and potentially expensive, rebalances during application startup.
group.initial.rebalance.delay.ms=0
启动kafka
# 在所有节点上启动kafka
root@kafka-node1:/apps#/apps/kafka/bin/kafka-server-start.sh -daemon /apps/kafka/config/server.properties
root@kafka-node2:/apps#/apps/kafka/bin/kafka-server-start.sh -daemon /apps/kafka/config/server.properties
root@kafka-node3:/apps#/apps/kafka/bin/kafka-server-start.sh -daemon /apps/kafka/config/server.properties
# 查看端口是否监听
root@kafka-node1:/apps/kafka# netstat -tnlp|grep 9092
tcp6       0      0 192.168.88.121:9092     :::*                    LISTEN      7084/java
5、部署logstash
下载安装logstash,地址:https://artifacts.elastic.co/downloads/logstash/logstash-7.6.2.deb
# 安装jdk
root@logstash:~# apt install openjdk-8-jdk

# 安装logstash
root@logstash:~# dpkg -i logstash-7.6.2.deb
Selecting previously unselected package logstash.
(Reading database ... 87206 files and directories currently installed.)
Preparing to unpack logstash-7.6.2.deb ...
Unpacking logstash (1:7.6.2-1) ...
Setting up logstash (1:7.6.2-1) ...
Using provided startup.options file: /etc/logstash/startup.options
/usr/share/logstash/vendor/bundle/jruby/2.5.0/gems/pleaserun-0.0.30/lib/pleaserun/platform/base.rb:112: warning: constant ::Fixnum is deprecated
Successfully created system startup script for Logstash
logstash配置文件/etc/logstash/conf.d/kafka-to-es.conf
input {
  kafka {
    bootstrap_servers => "192.168.88.121:9092,192.168.88.122:9092,192.168.88.123:9092"
    topics => ["tomcat-app"]
    codec => "json"
  }
}

output {
  if [fields][type] == "tomcat-accesslog" {
    elasticsearch {
      hosts => ["192.168.88.111:9200","192.168.88.112:9200","192.168.88.113:9200"]
      index => "tomcat-accesslog-%{+YYYY.MM.dd}"
    }
  }

  if [fields][type] == "tomcat-catalina" {
    elasticsearch {
      hosts => ["192.168.88.111:9200","192.168.88.112:9200","192.168.88.113:9200"]
      index => "tomcat-catalinalog-%{+YYYY.MM.dd}"
    }
  }

#  stdout {
#    codec => rubydebug
#  }
}
启动logstash
root@logstash:/etc/logstash# /usr/share/logstash/bin/logstash -f /etc/logstash/conf.d/kafka-to-es.conf
WARNING: Could not find logstash.yml which is typically located in $LS_HOME/config or /etc/logstash. You can specify the path using --path.settings. Continuing using the defaults
Could not find log4j2 configuration at path /usr/share/logstash/config/log4j2.properties. Using default config which logs errors to the console
[INFO ] 2022-03-01 03:38:53.260 [main] writabledirectory - Creating directory {:setting=>"path.queue", :path=>"/usr/share/logstash/data/queue"}
[INFO ] 2022-03-01 03:38:53.277 [main] writabledirectory - Creating directory {:setting=>"path.dead_letter_queue", :path=>"/usr/share/logstash/data/dead_letter_queue"}
[WARN ] 2022-03-01 03:38:53.494 [LogStash::Runner] multilocal - Ignoring the 'pipelines.yml' file because modules or command line options are specified
[INFO ] 2022-03-01 03:38:53.498 [LogStash::Runner] runner - Starting Logstash {"logstash.version"=>"7.6.2"}
[INFO ] 2022-03-01 03:38:53.513 [LogStash::Runner] agent - No persistent UUID file found. Generating new UUID {:uuid=>"f19b6f7f-4b61-41d4-b9c6-2f49d1a53567", :path=>"/usr/share/logstash/data/uuid"}
[INFO ] 2022-03-01 03:38:54.885 [Converge PipelineAction::Create<main>] Reflections - Reflections took 30 ms to scan 1 urls, producing 20 keys and 40 values
[INFO ] 2022-03-01 03:38:55.468 [[main]-pipeline-manager] elasticsearch - Elasticsearch pool URLs updated {:changes=>{:removed=>[], :added=>[http://192.168.88.111:9200/, http://192.168.88.112:9200/, http://192.168.88.113:9200/]}}
[WARN ] 2022-03-01 03:38:55.610 [[main]-pipeline-manager] elasticsearch - Restored connection to ES instance {:url=>"http://192.168.88.111:9200/"}
[INFO ] 2022-03-01 03:38:55.737 [[main]-pipeline-manager] elasticsearch - ES Output version determined {:es_version=>7}
[WARN ] 2022-03-01 03:38:55.739 [[main]-pipeline-manager] elasticsearch - Detected a 6.x and above cluster: the type event field won't be used to determine the document _type {:es_version=>`7}
[WARN ] 2022-03-01 03:38:55.837 [[main]-pipeline-manager] elasticsearch - Restored connection to ES instance {:url=>"http://192.168.88.112:9200/"}
[WARN ] 2022-03-01 03:38:56.119 [[main]-pipeline-manager] elasticsearch - Restored connection to ES instance {:url=>"http://192.168.88.113:9200/"}
[INFO ] 2022-03-01 03:38:56.309 [[main]-pipeline-manager] elasticsearch - New Elasticsearch output {:class=>"LogStash::Outputs::ElasticSearch", :hosts=>["//192.168.88.111:9200", "//192.168.88.112:9200", "//192.168.88.113:9200"]}
[INFO ] 2022-03-01 03:38:56.321 [[main]-pipeline-manager] elasticsearch - Elasticsearch pool URLs updated {:changes=>{:removed=>[], :added=>[http://192.168.88.111:9200/, http://192.168.88.112:9200/, http://192.168.88.113:9200/]}}
[WARN ] 2022-03-01 03:38:56.338 [[main]-pipeline-manager] elasticsearch - Restored connection to ES instance {:url=>"http://192.168.88.111:9200/"}
[INFO ] 2022-03-01 03:38:56.342 [[main]-pipeline-manager] elasticsearch - ES Output version determined {:es_version=>7}
[WARN ] 2022-03-01 03:38:56.343 [[main]-pipeline-manager] elasticsearch - Detected a 6.x and above cluster: the type event field won't be used to determine the document _type {:es_version=>`7}
[INFO ] 2022-03-01 03:38:56.382 [Ruby-0-Thread-6: :1] elasticsearch - Using default mapping template
[WARN ] 2022-03-01 03:38:56.385 [[main]-pipeline-manager] elasticsearch - Restored connection to ES instance {:url=>"http://192.168.88.112:9200/"}
[WARN ] 2022-03-01 03:38:56.435 [[main]-pipeline-manager] elasticsearch - Restored connection to ES instance {:url=>"http://192.168.88.113:9200/"}
...........................
6、部署kibana
在logstash主机上安装kibana,地址:https://artifacts.elastic.co/downloads/kibana/kibana-7.6.2-amd64.deb
root@logstash:~# dpkg -i kibana-7.6.2-amd64.deb
Selecting previously unselected package kibana.
(Reading database ... 103194 files and directories currently installed.)
Preparing to unpack kibana-7.6.2-amd64.deb ...
Unpacking kibana (7.6.2) ...
Setting up kibana (7.6.2) ...
Processing triggers for systemd (245.4-4ubuntu3.11) ...
kibana配置文件
# Kibana is served by a back end server. This setting specifies the port to use.
server.port: 5601

# Specifies the address to which the Kibana server will bind. IP addresses and host names are both valid values.
# The default is 'localhost', which usually means remote machines will not be able to connect.
# To allow connections from remote users, set this parameter to a non-loopback address.
server.host: "192.168.88.114"

# Enables you to specify a path to mount Kibana at if you are running behind a proxy.
# Use the server.rewriteBasePath setting to tell Kibana if it should remove the basePath
# from requests it receives, and to prevent a deprecation warning at startup.
# This setting cannot end in a slash.
#server.basePath: ""

# Specifies whether Kibana should rewrite requests that are prefixed with
# server.basePath or require that they are rewritten by your reverse proxy.
# This setting was effectively always false before Kibana 6.3 and will
# default to true starting in Kibana 7.0.
#server.rewriteBasePath: false

# The maximum payload size in bytes for incoming server requests.
#server.maxPayloadBytes: 1048576

# The Kibana server's name.  This is used for display purposes.
#server.name: "your-hostname"

# The URLs of the Elasticsearch instances to use for all your queries.
elasticsearch.hosts: ["http://192.168.88.111:9200"]

# When this setting's value is true Kibana uses the hostname specified in the server.host
# setting. When the value of this setting is false, Kibana uses the hostname of the host
# that connects to this Kibana instance.
#elasticsearch.preserveHost: true

# Kibana uses an index in Elasticsearch to store saved searches, visualizations and
# dashboards. Kibana creates a new index if the index doesn't already exist.
#kibana.index: ".kibana"

# The default application to load.
#kibana.defaultAppId: "home"

# If your Elasticsearch is protected with basic authentication, these settings provide
# the username and password that the Kibana server uses to perform maintenance on the Kibana
# index at startup. Your Kibana users still need to authenticate with Elasticsearch, which
# is proxied through the Kibana server.
#elasticsearch.username: "kibana"
#elasticsearch.password: "pass"

# Enables SSL and paths to the PEM-format SSL certificate and SSL key files, respectively.
# These settings enable SSL for outgoing requests from the Kibana server to the browser.
#server.ssl.enabled: false
#server.ssl.certificate: /path/to/your/server.crt
#server.ssl.key: /path/to/your/server.key

# Optional settings that provide the paths to the PEM-format SSL certificate and key files.
# These files are used to verify the identity of Kibana to Elasticsearch and are required when
# xpack.security.http.ssl.client_authentication in Elasticsearch is set to required.
#elasticsearch.ssl.certificate: /path/to/your/client.crt
#elasticsearch.ssl.key: /path/to/your/client.key

# Optional setting that enables you to specify a path to the PEM file for the certificate
# authority for your Elasticsearch instance.
#elasticsearch.ssl.certificateAuthorities: [ "/path/to/your/CA.pem" ]

# To disregard the validity of SSL certificates, change this setting's value to 'none'.
#elasticsearch.ssl.verificationMode: full

# Time in milliseconds to wait for Elasticsearch to respond to pings. Defaults to the value of
# the elasticsearch.requestTimeout setting.
#elasticsearch.pingTimeout: 1500

# Time in milliseconds to wait for responses from the back end or Elasticsearch. This value
# must be a positive integer.
#elasticsearch.requestTimeout: 30000

# List of Kibana client-side headers to send to Elasticsearch. To send *no* client-side
# headers, set this value to [] (an empty list).
#elasticsearch.requestHeadersWhitelist: [ authorization ]

# Header names and values that are sent to Elasticsearch. Any custom headers cannot be overwritten
# by client-side headers, regardless of the elasticsearch.requestHeadersWhitelist configuration.
#elasticsearch.customHeaders: {}

# Time in milliseconds for Elasticsearch to wait for responses from shards. Set to 0 to disable.
#elasticsearch.shardTimeout: 30000

# Time in milliseconds to wait for Elasticsearch at Kibana startup before retrying.
#elasticsearch.startupTimeout: 5000

# Logs queries sent to Elasticsearch. Requires logging.verbose set to true.
#elasticsearch.logQueries: false

# Specifies the path where Kibana creates the process ID file.
#pid.file: /var/run/kibana.pid

# Enables you specify a file where Kibana stores log output.
#logging.dest: stdout

# Set the value of this setting to true to suppress all logging output.
#logging.silent: false

# Set the value of this setting to true to suppress all logging output other than error messages.
#logging.quiet: false

# Set the value of this setting to true to log all events, including system usage information
# and all requests.
#logging.verbose: false

# Set the interval in milliseconds to sample system and process performance
# metrics. Minimum is 100ms. Defaults to 5000.
#ops.interval: 5000

# Specifies locale to be used for all localizable strings, dates and number formats.
# Supported languages are the following: English - en , by default , Chinese - zh-CN .
i18n.locale: "zh-CN"
启动kibana
root@logstash:~# systemctl start kibana
root@logstash:~# netstat -tnlp | grep 5601
tcp        0      0 192.168.88.114:5601     0.0.0.0:*               LISTEN      6443/node
root@logstash:~#
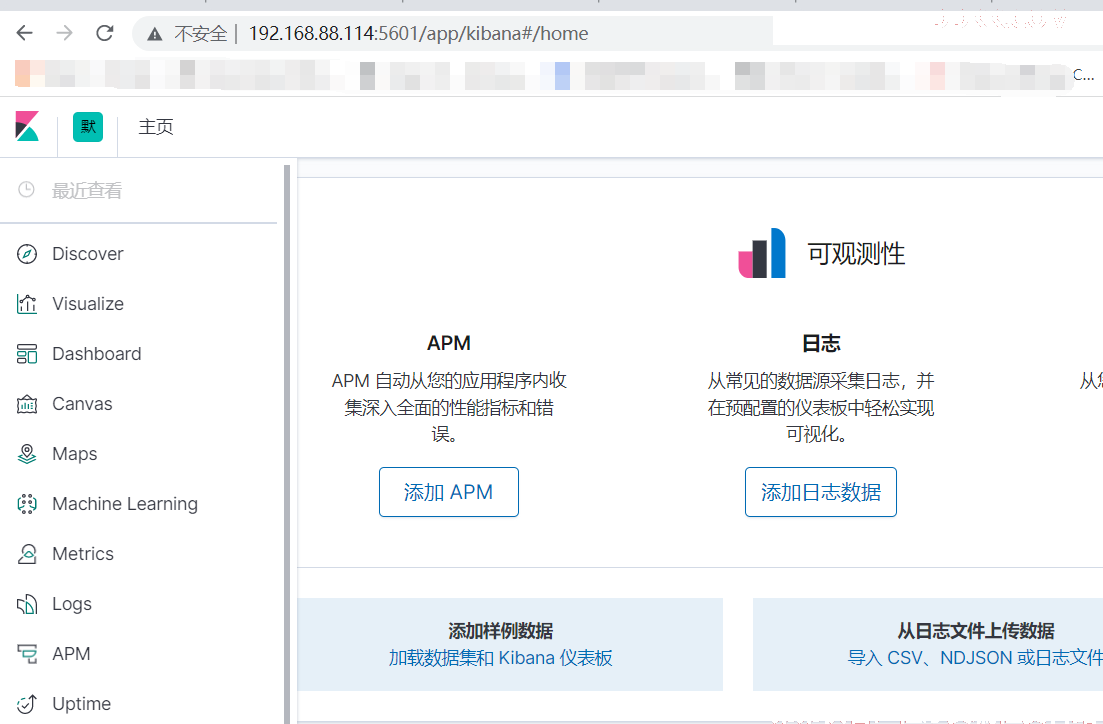
访问kibana
三、收集pod日志
1.构建filebeat镜像
下载filebeat包,地址:https://www.elastic.co/cn/downloads/past-releases/filebeat-7-6-2
# 目录结构
root@k8s-deploy:~# cd dockerfile/filebeat/
root@k8s-deploy:~/dockerfile/filebeat# ls
Dockerfile  filebeat-7.6.2-amd64.deb  start.sh
root@k8s-deploy:~/dockerfile/filebeat# cat Dockerfile
FROM ubuntu:latest

COPY filebeat-7.6.2-amd64.deb /tmp/
COPY start.sh /
RUN dpkg -i /tmp/filebeat-7.6.2-amd64.deb

CMD ["/start.sh"]
root@k8s-deploy:~/dockerfile/filebeat# cat start.sh
#!/bin/bash
/usr/share/filebeat/bin/filebeat -e -c /etc/filebeat/filebeat.yml -path.home /usr/share/filebeat/ -path.config /etc/filebeat/ -path.data /var/lib/filebeat/ -path.logs /var/log/filebeat/
# 构建镜像并推送到harbor
root@k8s-deploy:~/dockerfile/filebeat# docker build -t harbor.zhrx.com/baseimages/filebeat:7.6.2 ./
Sending build context to Docker daemon  25.08MB
Step 1/5 : FROM ubuntu:latest
 ---> 54c9d81cbb44
Step 2/5 : COPY filebeat-7.6.2-amd64.deb /tmp/
 ---> a177696affed
Step 3/5 : COPY start.sh /
 ---> 478413f958db
Step 4/5 : RUN dpkg -i /tmp/filebeat-7.6.2-amd64.deb
 ---> Running in 357f27d24a45
Selecting previously unselected package filebeat.
(Reading database ... 4127 files and directories currently installed.)
Preparing to unpack /tmp/filebeat-7.6.2-amd64.deb ...
Unpacking filebeat (7.6.2) ...
Setting up filebeat (7.6.2) ...
Removing intermediate container 357f27d24a45
 ---> d53c35fb0718
Step 5/5 : CMD ["/start.sh"]
 ---> Running in aa87e42ef210
Removing intermediate container aa87e42ef210
 ---> 3e77efe66f2e
Successfully built 3e77efe66f2e
Successfully tagged harbor.zhrx.com/baseimages/filebeat:7.6.2
root@k8s-deploy:~/dockerfile/filebeat# docker push harbor.zhrx.com/baseimages/filebeat:7.6.2
The push refers to repository [harbor.zhrx.com/baseimages/filebeat]
cbec1e065e40: Pushed
49a0b43eaeb5: Pushed
9198cc67bb2b: Pushed
36ffdceb4c77: Pushed
7.6.2: digest: sha256:a5509a9d534997e25c07dedadacaccfea3c55ef8e72b07fba946b132891421c8 size: 1160
root@k8s-deploy:~/dockerfile/filebeat#
filebeat配置文件,以configmap的方式提供配置
root@k8s-deploy:~# cat filebeat-config.yml
apiVersion: v1
kind: ConfigMap
metadata:
  name: filebeat-config
data:
  filebeat.yml: |-
    filebeat.inputs:
    - type: log
      enabled: true
      paths:
        - /usr/local/tomcat/logs/catalina.*.log
      fields:
        type: tomcat-catalina
    - type: log
      enabled: true
      paths:
        - /usr/local/tomcat/logs/localhost_access_log.*.txt
      fields:
        type: tomcat-accesslog
    filebeat.config.modules:
      path: ${path.config}/modules.d/*.yml
      reload.enabled: false
    setup.template.settings:
      index.number_of_shards: 1
    setup.kibana:

    output.kafka:
      hosts: ["192.168.88.121:9092"]
      required_acks: 1
      topic: "tomcat-app"
      compression: gzip
      max_message_bytes: 1000000
2、运行tomcat pod
tomcat.yml
apiVersion: apps/v1
kind: Deployment
metadata:
  labels:
    app: tomcat-app
  name: tomcat-app
spec:
  replicas: 1
  selector:
    matchLabels:
      app: tomcat-app
  template:
    metadata:
      labels:
        app: tomcat-app
    spec:
      imagePullSecrets:
      - name: harbor
      containers:
      - name: filebeat
        image: harbor.zhrx.com/baseimages/filebeat:7.6.2
        imagePullPolicy: IfNotPresent
        volumeMounts:
        - name: log
          mountPath: /usr/local/tomcat/logs
        - name: filebeat-config
          mountPath: /etc/filebeat/filebeat.yml
          subPath: filebeat.yml
      - name: tomcat
        image: harbor.zhrx.com/baseimages/tomcat:7.0.94-alpine
        imagePullPolicy: IfNotPresent
        ports:
        - containerPort: 8080
          protocol: TCP
          name: http
        volumeMounts:
        - name: log
          mountPath: /usr/local/tomcat/logs
      volumes:
      - name: log
        emptyDir: {}
      - name: filebeat-config
        configMap:
          name: filebeat-config
---
kind: Service
apiVersion: v1
metadata:
  labels:
    app: tomcat-svc
  name: tomcat-svc
spec:
  type: NodePort
  ports:
  - name: http
    port: 80
    protocol: TCP
    targetPort: 8080
    nodePort: 30005
  selector:
    app: tomcat-app
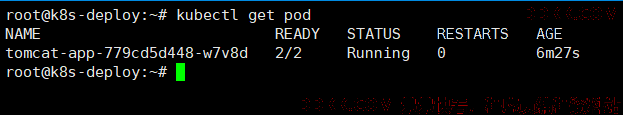
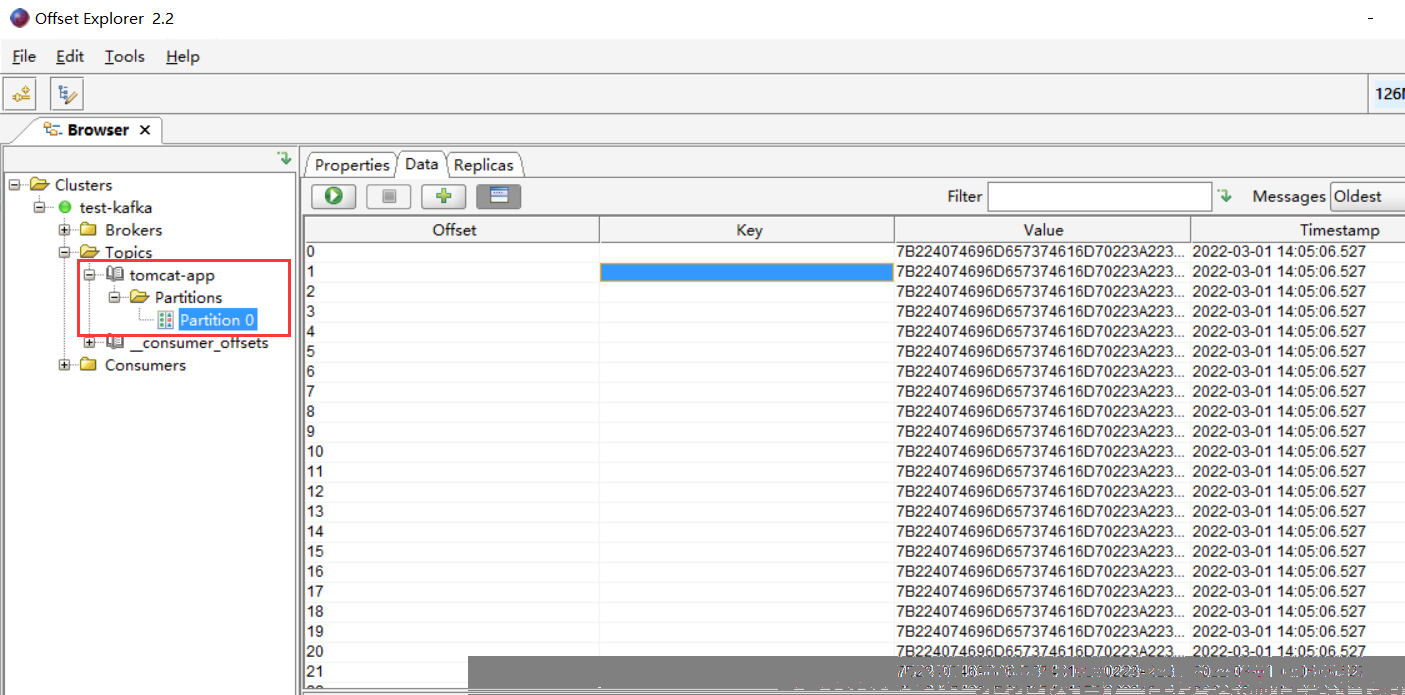
3、验证数据
此时kafka里已经可与看到tomcat-app这个topic的数据
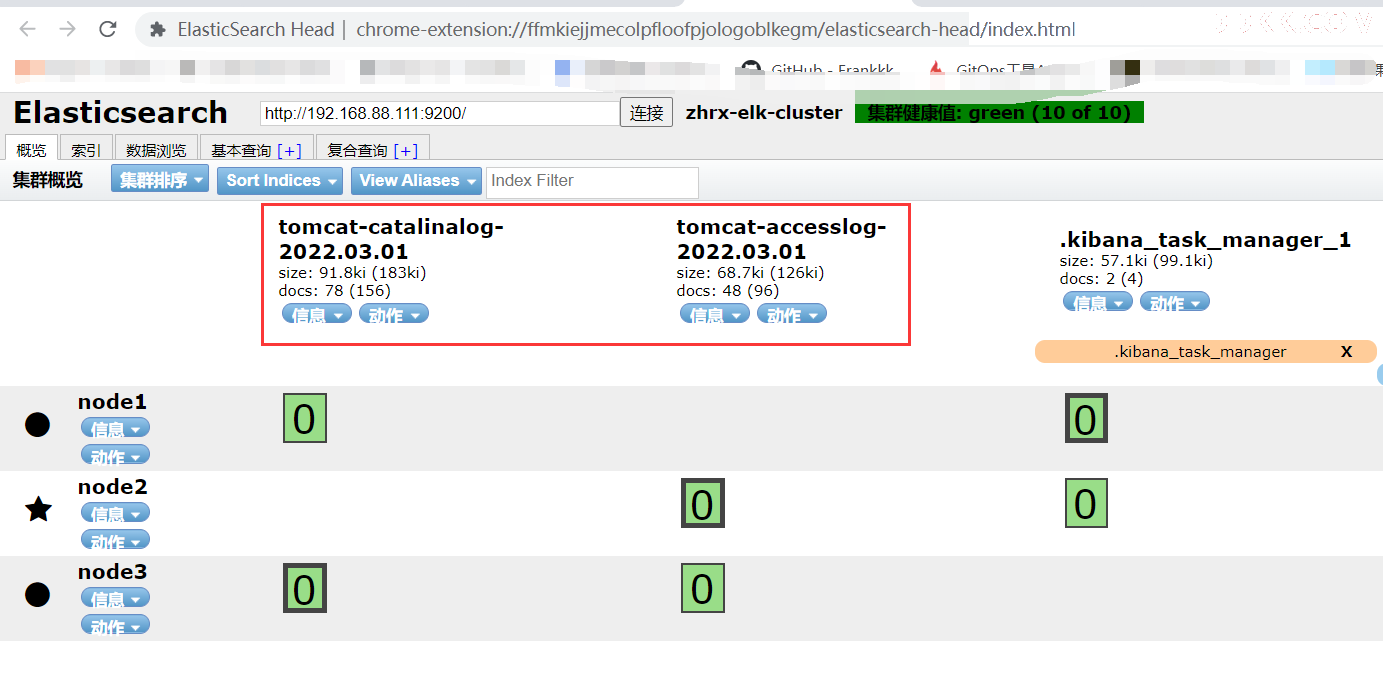
es集群里也有了数据
kibana里也已经有了索引数据
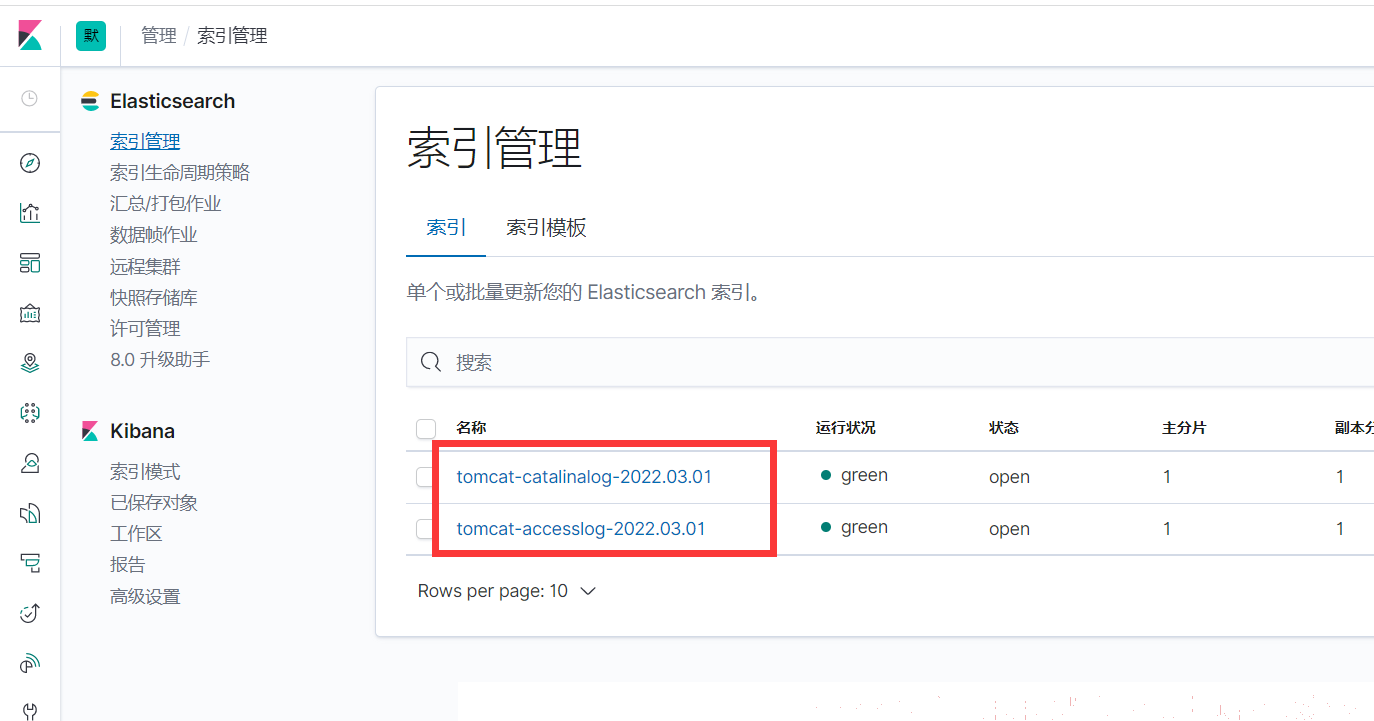
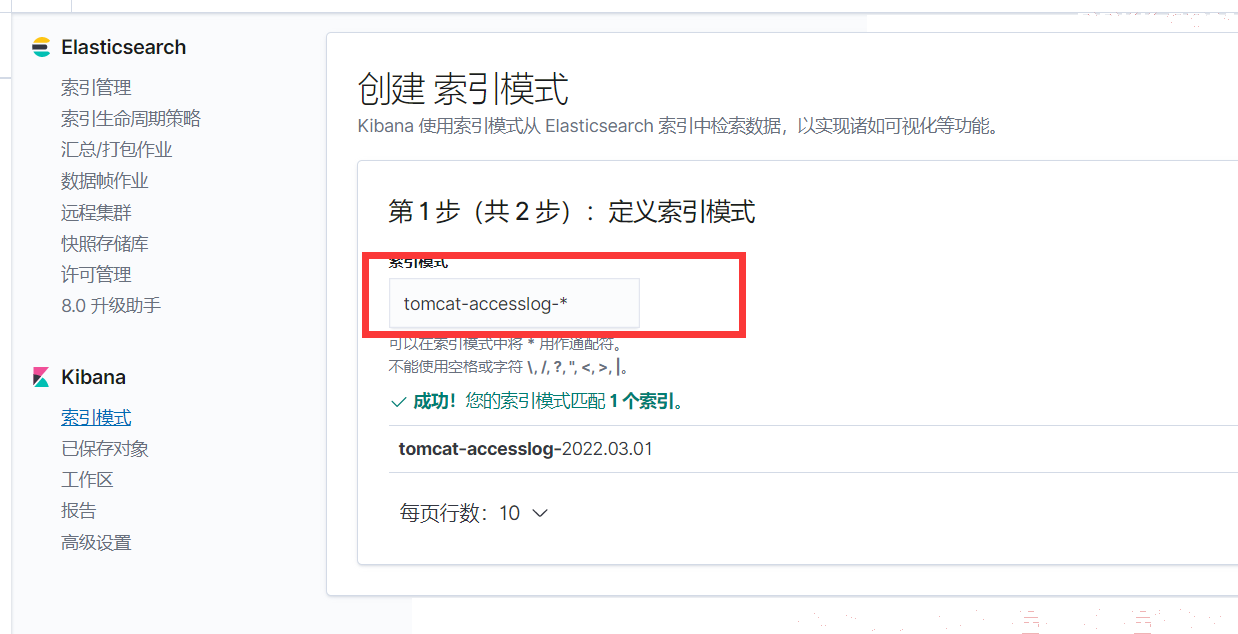
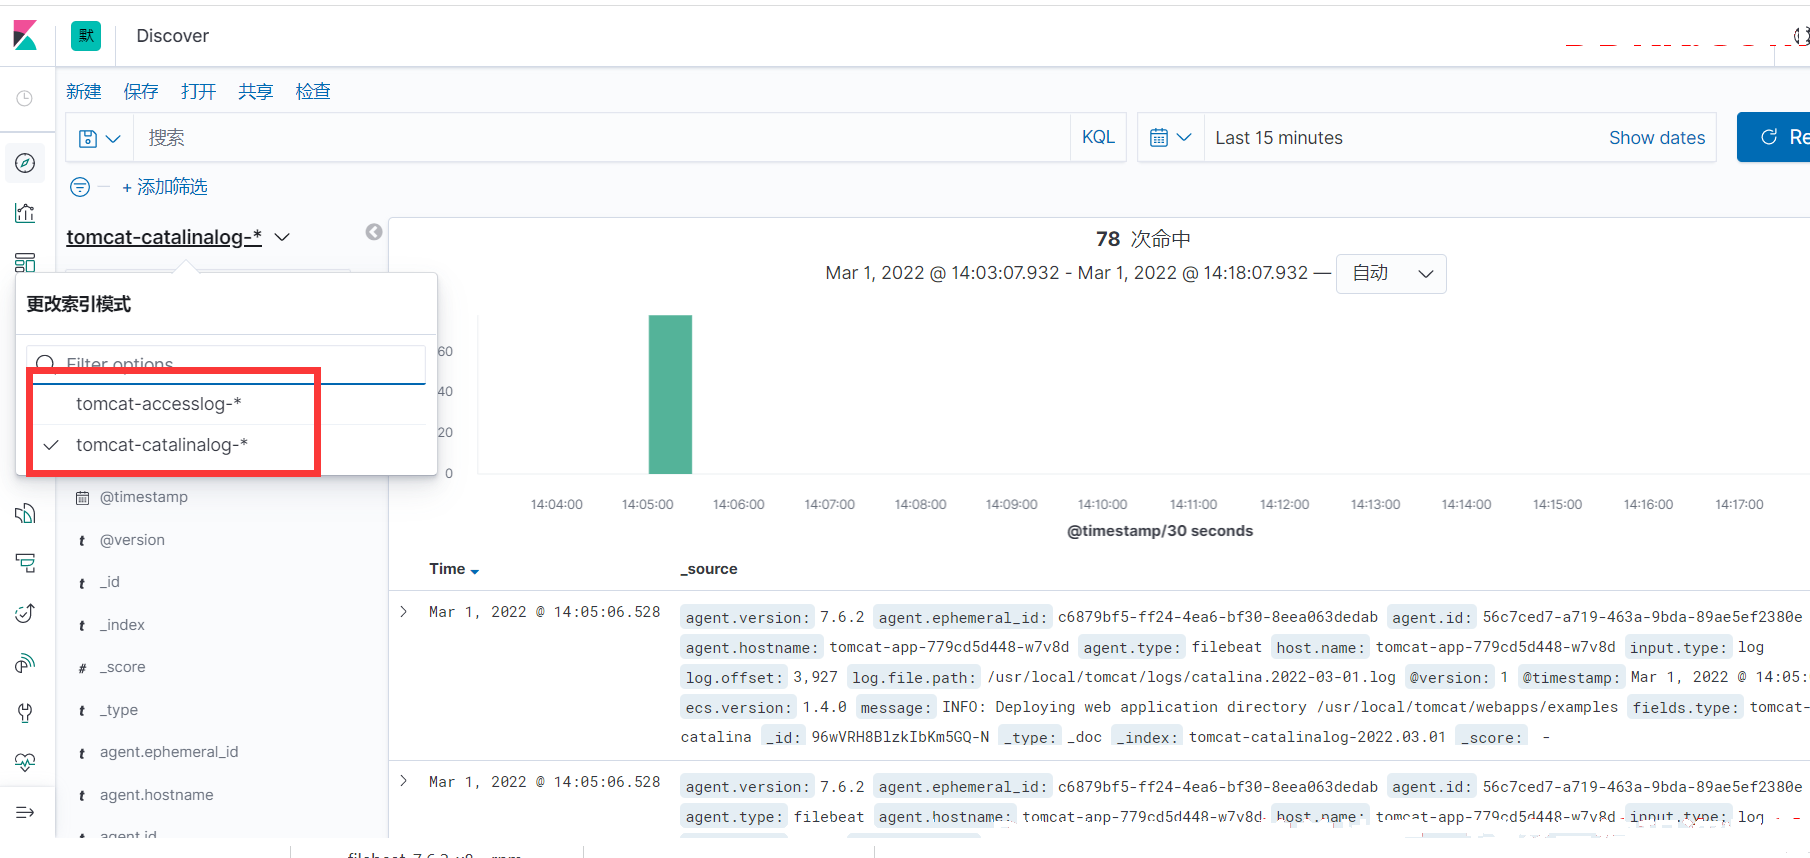
4、kibana添加索引
至此就可以通过kibana查看日志了
完结