SpringCloud 分布式链路踪系 Sleuth + Zipkin
1.概述
”链路追踪“一词首次在google的Dapper论文中出现,该论文介绍了google自研的分布式链路追踪的实现原理,还介绍了他们是怎么低成本实现对应用透明的。Dapper论文一开始介绍的只是一个独立的链路调用系统,后来逐步演化成了监控平台,并且基于监控平台衍生出了许多工具,比如实时预警、过载保护等。单纯的理解链路追踪,就是记录一次请求开始到结束,期间所调用的系统及耗时都能被完整的记录下来。 现在所说的链路追踪系统,都是具有一套相对比较完整的功能,不仅具备记录功能,还具备一大堆衍生功能,让人能够更清楚查看整个流程。比如阿里的鹰眼、大众点评的CAT、Twitter的Zipkin以及国产开源的SkyWalking(已捐献给apache)等。本文将主要介绍基于Spring Cloud Sleuth和Zipkin的链路追踪系统,同时接入ELK(Elasticsearch,Logstash 和 Kibana)实现链路追踪日志的存储与搜索展示等。
2.链路追踪原理及实现
2.1 什么是Sleuth
Spring Cloud Sleuth为Spring Cloud实现了分布式跟踪解决方案,兼容Zipkin、HTrace等其它基于日志的追踪系统,例如ELK。
Spring Cloud Sleuth提供的功能如下:
1、链路追踪:通过Sleuth可以很清楚地看出一个请求都经过哪些服务,可以很方便地理清服务之间的关系;
2、性能分析:通过Sleuth可以很方便地看出每个采样请求的耗时,分析哪些服务调用比较耗时,当服务调用的耗时随着请求量的增大而增大时,可以提示进行扩容操作;
3、数据分析、链路优化:对于频繁调用一个服务或并行调用时,可以针对业务做一些优化措施;
4、可视化错误:对于程序未捕获的异常,可以配合Zipkin查看。
2.2 Sleuth中一些基础术语
这些术语可以帮助更好理解Sleuth工作原理以及工作方式,大部分术语来自于Dapper论文以及SpringBoot关于Slueth的官方介绍文档。具体有Span、Trace和Annotation。
2.2.1 Span
一次单独的调用链可以称为一个Span,它是链路追踪的基本工作单位。在Dapper的论文中,他记录的是每个Span的名称,以及每个Span的id和父id,用来重建一次追踪过程中每个Span之间的关系。下图中,客户端请求微服务1,此时就产生了一个span,微服务1又分别调用了服务2和服务3,又分别产生了两个spanId为2和spanId为3的调用过程,同时spanId为2、spanId为3的记录中对应的parentId均为1,因为它们都是由微服务1调用。简单来说,span就是一次请求信息,一次调用过程。开始跟踪的初始跨度称为root span,下图中主要体现在客户端调用微服务1,因此它的parentId为null。
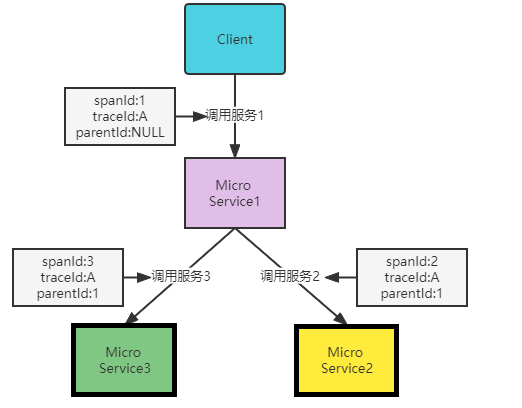
2.2.2 Trace
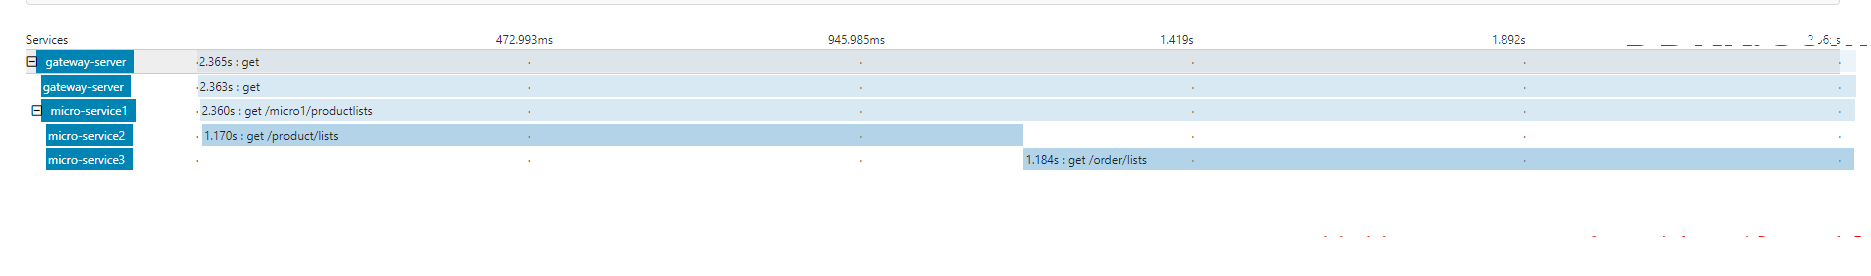
一系列Span组成的树状结构,称为Trace。一个Trace指的是一次完整的链路调用,内部包含n个Span,同一次请求调用中的traceId是相同的。Span与Span之间主要存在父子关系,Trace与Span之间存在一对多的包含关系。以上图1为例,客户端调用服务1,而服务1又分别调用了服务2和服务3,这一整个流程就是一条Trace。Client ->Micro Service1->Micro Service2->Micro Service3。如果链路追踪最好了,链路数据充分,借助前端解析工具和渲染工具,可以达到下图2效果:
2.2.3 Annotation
它用来及时记录一个事件的存在,一些核心annotations用来定义一个请求的开始和结束,用来获取一些关键信息。具体如下:
- CS(Client Sent):客户端发起一个请求,这个annotation描述了这个span的开始;
- SR(Server Received):服务端获得请求并开始处理它,利用SR时间戳减去CS时间戳便可得到网络延迟;
- SS(Server-Sent):请求处理完成(当请求返回给客户端),利用SS时间戳减去SR时间戳便可得到服务端处理请求需要得时间;
- CR(Client Received):表示Span结束(客户端成功接收到服务端回复),利用CR时间戳减去CS时间戳便可得到客户端从服务端获取回复的整个请求时间。
2.3 Zipkin原理
zipkin主要包含四个重要的组件:Collector、Storage、Web UI、RESTful API。
- Collector:收集器组件,处理从外部系统发送过来的跟踪信息,将这些信息转换为zipkin内部处理的span格式,以支持后续的存储、分析、展示等功能;
- Storage:存储组件,处理收集器接收到的跟踪信息,默认将信息存储在内存中,可以修改为所需要的存储组件,支持MySQL、Kafka、Elasticsearch等;
- Web UI:UI组件,基于API组件实现的上层应用,提供Web页面,用来展示zipkin中调用链和依赖关系;
- RESTful API:API组件,为Web界面提供查询存储数据的接口。
具体工作原理图如下图所示:
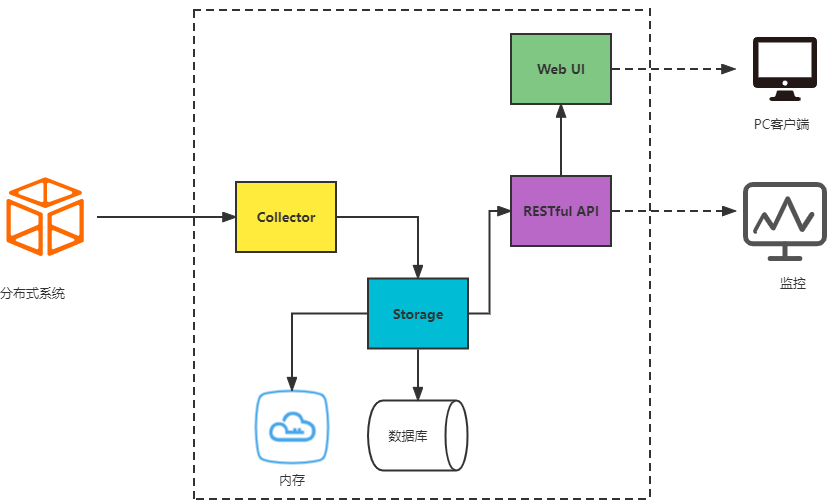
Collector收集器收集了链路之间的调用信息,存入了到指定的收集容器中(内存或数据库),通过指定的RESTful API接口向外提供追踪数据,zipkin自带了Web UI来展示链路调用信息(也是通过调用RESTful API接口获取链路追踪数据)。
zipkin分为服务端和客户端,客户端主要指的是需要被追踪的服务(调用方或者被调用方),客户端需要配置服务端的地址,一旦发生服务间的调用的时候,会被配置在服务中的sleuth监听器监听,生成相应的Trace和Span发送给服务端,发送的方式有两种,一种是消息总线方式(Kafka或RabbitMQ),另一种是HTTP报文的方式发送。
2.4 链路追踪案例演示
2.4.1 搭建zipkin服务端
为了展示链路追踪案例,本文搭建了一套简易环境。首先需要安装一个zipkin服务端,用来收集链路追踪的日志信息。这些信息的存储方式包括存储到MYSQL、Kafka、ELK等,也可以存储到缓存中。本文展示的案例这些链路追踪信息会被存储到MYSQL,下一篇将详细介绍存储到Kafka和ELK。zipkin的安装很简单,在官网下载一个jar包,根据自己的安装环境选择合适的jar包,我这里安装的环境是CentOS 7.6,官网提供的安装代码如下:
curl -sSL https://zipkin.io/quickstart.sh | bash -s
安装完成之后,需要启动服务,直接可以利用:
java -jar zipkin.jar
这种启动方式缺陷很明显,首先不是后台运行,当命令窗口退出时,服务就会停止;其次这种方式不能持久化记录链路数据,重启后所有的链路数据都会消失。本文将链路数据存储在MySQL,因此需要指定MYSQL的配置,编写脚本如下:
nohup java -jar zipkin.jar --STORAGE_TYPE=mysql --MYSQL_HOST=localhost --MYSQL_TCP_PORT=3306 --MYSQL_USER=root --MYSQL_PASS=123456 --MYSQL_DB=zipkin_test 2>&1 &
注意:上述启动脚本要和下载的zipkin jar包放在同一目录下,才能顺利启动。若不放在同一目录,需要添加zipkin jar包的完整路径。
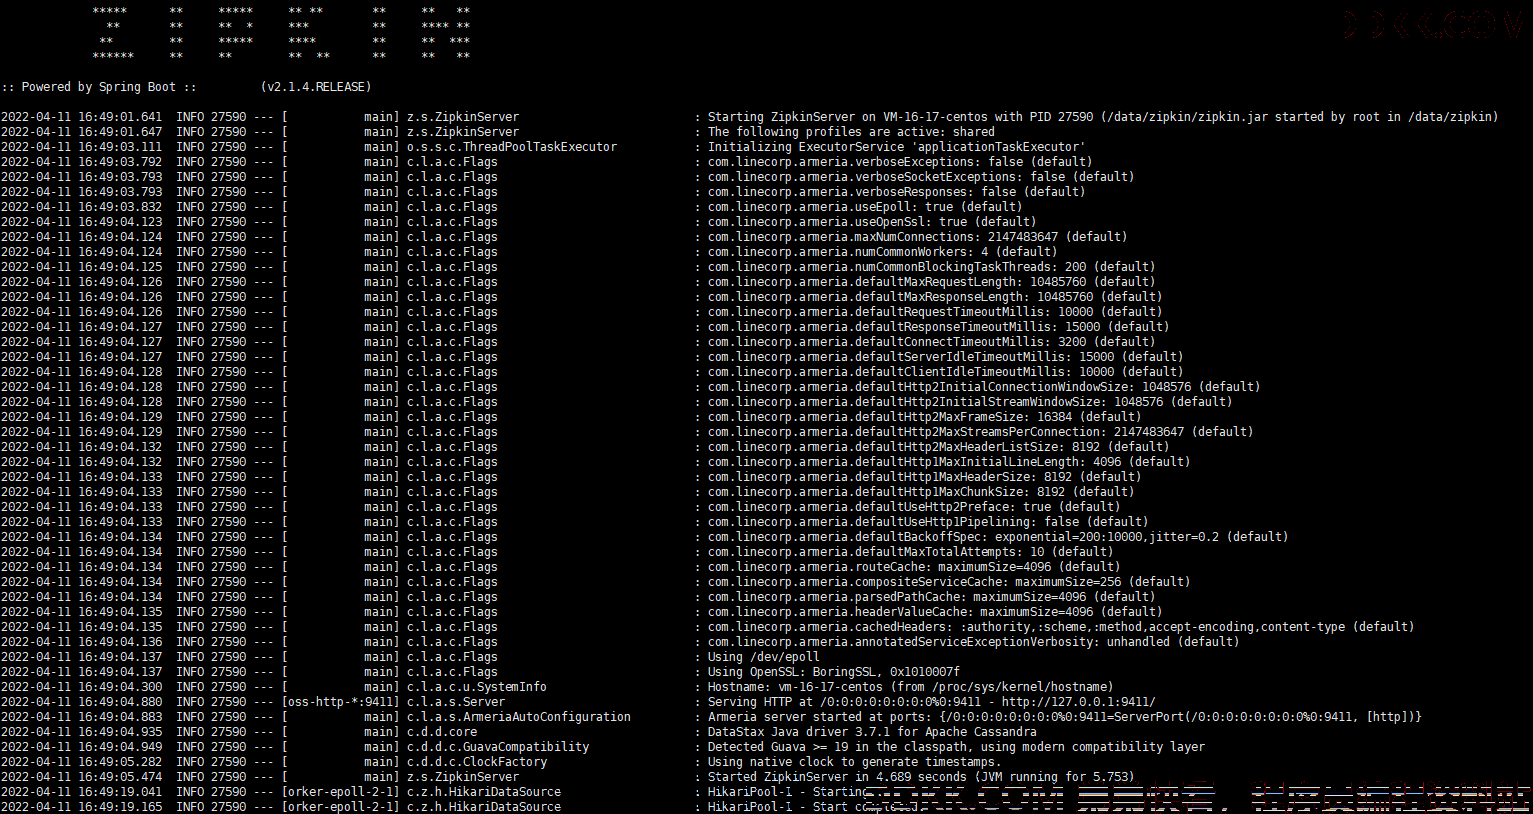
利用脚本启动服务,启动成功后会出现以下日志:
2.4.2 测试案例
案例主要流程如下:
1.客户端请求服务1(实际上是客户端请求网关服务,由网关服务进行服务转发);
2.服务1分别调用服务2、服务3,查询商品列表和订单列表。
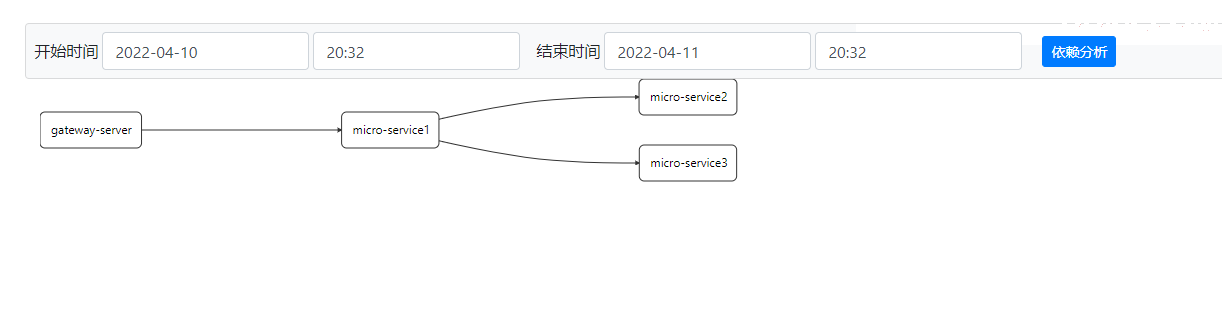
服务间的调用关系图如下图所示:
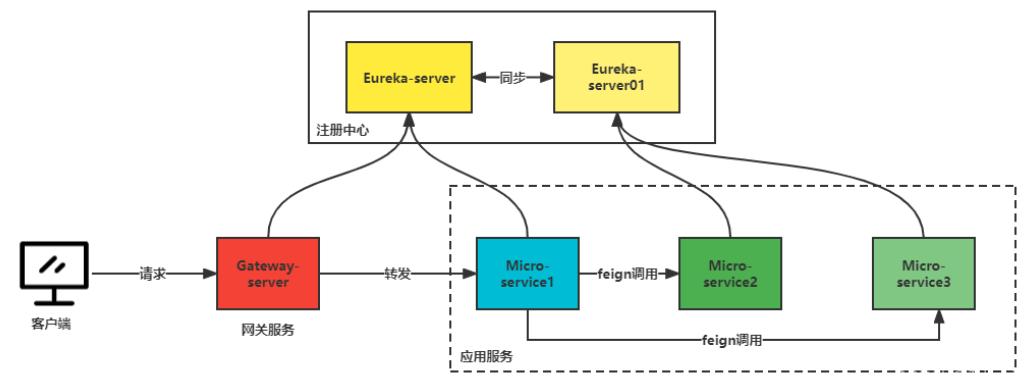
主要包含的服务有:
- gateway-server(网关服务):服务统一经过网关,过滤一些不合法服务;
- eureka-server(主注册中心):服务注册中心,负责其它服务管理;
- eureka-server01(从注册中心):服务注册中心,与主注册中心共同作用,减少宕机影响服务调用;
- MicroService1(服务1,负责调用服务2和服务3):服务1主要用来调用服务2和服务3,展示追踪链路;
- MicroService2(服务2,商品服务):商品服务,主要负责针对商品操作的服务;
- MicroService3(服务3,订单服务):主要针对订单操作的服务。
2.4.3 gateway-server
1.pom文件引用
        <dependency>
            <groupId>org.springframework.cloud</groupId>
            <artifactId>spring-cloud-starter-gateway</artifactId>
        </dependency>
2.配置文件
spring.application.name=gateway-server
#启用了自动根据服务ID建立路由
spring.cloud.gateway.discovery.locator.enabled=true
#请求路径上的服务名配置为小写
spring.cloud.gateway.discovery.locator.lower-case-service-id=true
server.port=9000
eureka.instance.prefer-ip-address=true
eureka.instance.instance-id=${spring.cloud.client.ip-address}:${server.port}
eureka.client.service-url.defaultZone=http://172.200.96.76:8761/eureka/,http://172.200.96.76:8762/eureka/
spring.datasource.url=jdbc:mysql://localhost:3306/zipkin_test?useUnicode=true&characterEncoding=UTF-8&allowMultiQueries=true&autoReconnect=true&failOverReadOnly=false&maxReconnects=1000&initialTimeout=30
spring.datasource.username=
spring.datasource.password=
spring.datasource.driver-class-name=com.mysql.jdbc.Driver
#zipkin服务端地址
spring.zipkin.base-url=http://124.223.181.150:9411/
#链路数据发送方式(Kafka、RabbitMQ、Web、activeMQ)web表示采用http请求发送
spring.zipkin.sender.type=web
#数据采集样本率(1.0表示所有请求都采集)
spring.sleuth.sampler.probability=1.0
由于本文主要是模拟微服务调用环境,因此网关服务没有编写其它代码。各位可根据自己的需求添加代码(路由规则等)。
3.启动类
package com.eckey.lab;

import org.springframework.boot.SpringApplication;
import org.springframework.boot.autoconfigure.SpringBootApplication;

@SpringBootApplication
public class GateWayServerApplication {


    public static void main(String[] args) {


        SpringApplication.run(GateWayServerApplication.class, args);
    }
}
2.4.4 eureka-server
1.pom文件引用
        <dependency>
            <groupId>org.springframework.cloud</groupId>
            <artifactId>spring-cloud-netflix-eureka-server</artifactId>
        </dependency>
2.配置文件
spring.application.name=eureka-server
server.port=8761
eureka.instance.hostname=eureka-server-main
#eureka注册实例id为该服务器的IP+端口
eureka.instance.instance-id=${spring.cloud.client.ip-address}:${server.port}
eureka.client.service-url.defaultZone=http://172.200.96.76:8762/eureka/
spring.datasource.url=jdbc:mysql://127.0.0.1:3306/test?useUnicode=true&characterEncoding=UTF-8&allowMultiQueries=true&autoReconnect=true&failOverReadOnly=false&maxReconnects=1000&initialTimeout=30
spring.datasource.username=
spring.datasource.password=
spring.datasource.driver-class-name=com.mysql.jdbc.Driver
eureka.instance.prefer-ip-address=true
#注册时指定网卡注册
spring.cloud.inetutils.preferred-networks=172.200.96
#zipkin服务端地址
spring.zipkin.base-url=http://124.223.181.150:9411/
#链路数据发送方式(Kafka、RabbitMQ、Web、activeMQ)web表示采用http请求发送
spring.zipkin.sender.type=web
#数据采集样本率(1.0表示所有请求都采集)
spring.sleuth.sampler.probability=1.0
3.启动类
package com.eckey.lab;

import org.springframework.boot.SpringApplication;
import org.springframework.boot.autoconfigure.SpringBootApplication;
import org.springframework.cloud.netflix.eureka.server.EnableEurekaServer;

@EnableEurekaServer
@SpringBootApplication
public class EurekaServerApplication {


    public static void main(String[] args) {


        SpringApplication.run(EurekaServerApplication.class, args);
    }
}
2.4.5 eureka-server01
此服务代码与eureka-server代码基本无差别,唯一区别在于配置文件有些许变更,变更部分如下:
server.port=8762
eureka.instance.hostname=eureka-server-slave
2.4.6 micro-service1
1.pom文件
        <dependency>
            <groupId>org.springframework.cloud</groupId>
            <artifactId>spring-cloud-starter-netflix-eureka-client</artifactId>
        </dependency>
        <dependency>
            <groupId>org.springframework.cloud</groupId>
            <artifactId>spring-cloud-starter-openfeign</artifactId>
        </dependency>
2.配置文件
spring.application.name=micro-service1
server.port=9091
eureka.instance.prefer-ip-address=true
eureka.instance.instance-id=${spring.cloud.client.ip-address}:${server.port}
eureka.client.service-url.defaultZone=http://172.200.96.76:8761/eureka/,http://172.200.96.76:8762/eureka/
spring.datasource.url=jdbc:mysql://localhost:3306/zipkin_test?useUnicode=true&characterEncoding=UTF-8&allowMultiQueries=true&autoReconnect=true&failOverReadOnly=false&maxReconnects=1000&initialTimeout=30
spring.datasource.username=
spring.datasource.password=
spring.datasource.driver-class-name=com.mysql.jdbc.Driver
mybatis.mapper-locations=classpath*:/mapper/*.xml
logging.level.com.eckey.lab.feign=debug
ribbon.ReadTimeout=30000
ribbon.ConnectTimeout=30000
#feign.client.config.default.connectTimeout=20000
#feign.client.config.default.readTimeout=50000
#logging.config=classpath:logback-spring.xml
spring.zipkin.base-url=http://124.223.181.150:9411/
spring.zipkin.sender.type=web
spring.sleuth.sampler.probability=1.0
eureka.instance.ip-address=172.200.96.76
spring.cloud.inetutils.preferred-networks=172.200.96
3.ProductFeign
package com.eckey.lab.feign;

import com.eckey.lab.fallback.ProductFallbackFeign;
import org.springframework.cloud.openfeign.FeignClient;
import org.springframework.web.bind.annotation.GetMapping;

@FeignClient(value = "micro-service2", fallback = ProductFallbackFeign.class)
public interface ProductFeign {


    @GetMapping("/product/lists")
    String lists();

}
4.ProductFallbackFeign
package com.eckey.lab.fallback;

import com.eckey.lab.feign.ProductFeign;
import lombok.extern.slf4j.Slf4j;
import org.springframework.stereotype.Component;

@Slf4j
public class ProductFallbackFeign implements ProductFeign {


    @Override
    public String lists() {


        log.error("ProductFallbackFeign调用异常!");
        return null;
    }
}
核心关键代码及配置基本已经完善,这里就不再赘述,如果需要完整代码,请查看文章末尾附录部分。
注意:
由于上述服务请求过程均需要展示,因此每个服务都需要添加sleuth依赖:
       <dependency>
            <groupId>org.springframework.cloud</groupId>
            <artifactId>spring-cloud-starter-sleuth</artifactId>
        </dependency>
2.4.7 micro-service1与micro-service2
此部分业务代码参见附录,此处不再赘述。
2.4.8 zipkin存储建表语句
CREATE TABLE zipkin_annotations (
  trace_id_high bigint(20) NOT NULL DEFAULT '0' COMMENT 'If non zero, this means the trace uses 128 bit traceIds instead of 64 bit',
  trace_id bigint(20) NOT NULL COMMENT 'coincides with zipkin_spans.trace_id',
  span_id bigint(20) NOT NULL COMMENT 'coincides with zipkin_spans.id',
  a_key varchar(255) NOT NULL COMMENT 'BinaryAnnotation.key or Annotation.value if type == -1',
  a_value blob COMMENT 'BinaryAnnotation.value(), which must be smaller than 64KB',
  a_type int(11) NOT NULL COMMENT 'BinaryAnnotation.type() or -1 if Annotation',
  a_timestamp bigint(20) DEFAULT NULL COMMENT 'Used to implement TTL; Annotation.timestamp or zipkin_spans.timestamp',
  endpoint_ipv4 int(11) DEFAULT NULL COMMENT 'Null when Binary/Annotation.endpoint is null',
  endpoint_ipv6 binary(16) DEFAULT NULL COMMENT 'Null when Binary/Annotation.endpoint is null, or no IPv6 address',
  endpoint_port smallint(6) DEFAULT NULL COMMENT 'Null when Binary/Annotation.endpoint is null',
  endpoint_service_name varchar(255) DEFAULT NULL COMMENT 'Null when Binary/Annotation.endpoint is null',
  UNIQUE KEY trace_id_high (trace_id_high,trace_id,span_id,a_key,a_timestamp) COMMENT 'Ignore insert on duplicate',
  KEY trace_id_high_2 (trace_id_high,trace_id,span_id) COMMENT 'for joining with zipkin_spans',
  KEY trace_id_high_3 (trace_id_high,trace_id) COMMENT 'for getTraces/ByIds',
  KEY endpoint_service_name (endpoint_service_name) COMMENT 'for getTraces and getServiceNames',
  KEY a_type (a_type) COMMENT 'for getTraces and autocomplete values',
  KEY a_key (a_key) COMMENT 'for getTraces and autocomplete values',
  KEY trace_id (trace_id,span_id,a_key) COMMENT 'for dependencies job'
) ENGINE=InnoDB DEFAULT CHARSET=utf8 ROW_FORMAT=COMPRESSED;

CREATE TABLE zipkin_dependencies (
  day date NOT NULL,
  parent varchar(255) NOT NULL,
  child varchar(255) NOT NULL,
  call_count bigint(20) DEFAULT NULL,
  error_count bigint(20) DEFAULT NULL,
  PRIMARY KEY (day,parent,child)
) ENGINE=InnoDB DEFAULT CHARSET=utf8 ROW_FORMAT=COMPRESSED;
CREATE TABLE zipkin_spans (
  trace_id_high bigint(20) NOT NULL DEFAULT '0' COMMENT 'If non zero, this means the trace uses 128 bit traceIds instead of 64 bit',
  trace_id bigint(20) NOT NULL,
  id bigint(20) NOT NULL,
  name varchar(255) NOT NULL,
  remote_service_name varchar(255) DEFAULT NULL,
  parent_id bigint(20) DEFAULT NULL,
  debug bit(1) DEFAULT NULL,
  start_ts bigint(20) DEFAULT NULL COMMENT 'Span.timestamp(): epoch micros used for endTs query and to implement TTL',
  duration bigint(20) DEFAULT NULL COMMENT 'Span.duration(): micros used for minDuration and maxDuration query',
  PRIMARY KEY (trace_id_high,trace_id,id),
  KEY trace_id_high (trace_id_high,trace_id) COMMENT 'for getTracesByIds',
  KEY name (name) COMMENT 'for getTraces and getSpanNames',
  KEY remote_service_name (remote_service_name) COMMENT 'for getTraces and getRemoteServiceNames',
  KEY start_ts (start_ts) COMMENT 'for getTraces ordering and range'
) ENGINE=InnoDB DEFAULT CHARSET=utf8 ROW_FORMAT=COMPRESSED;
2.5 测试验证
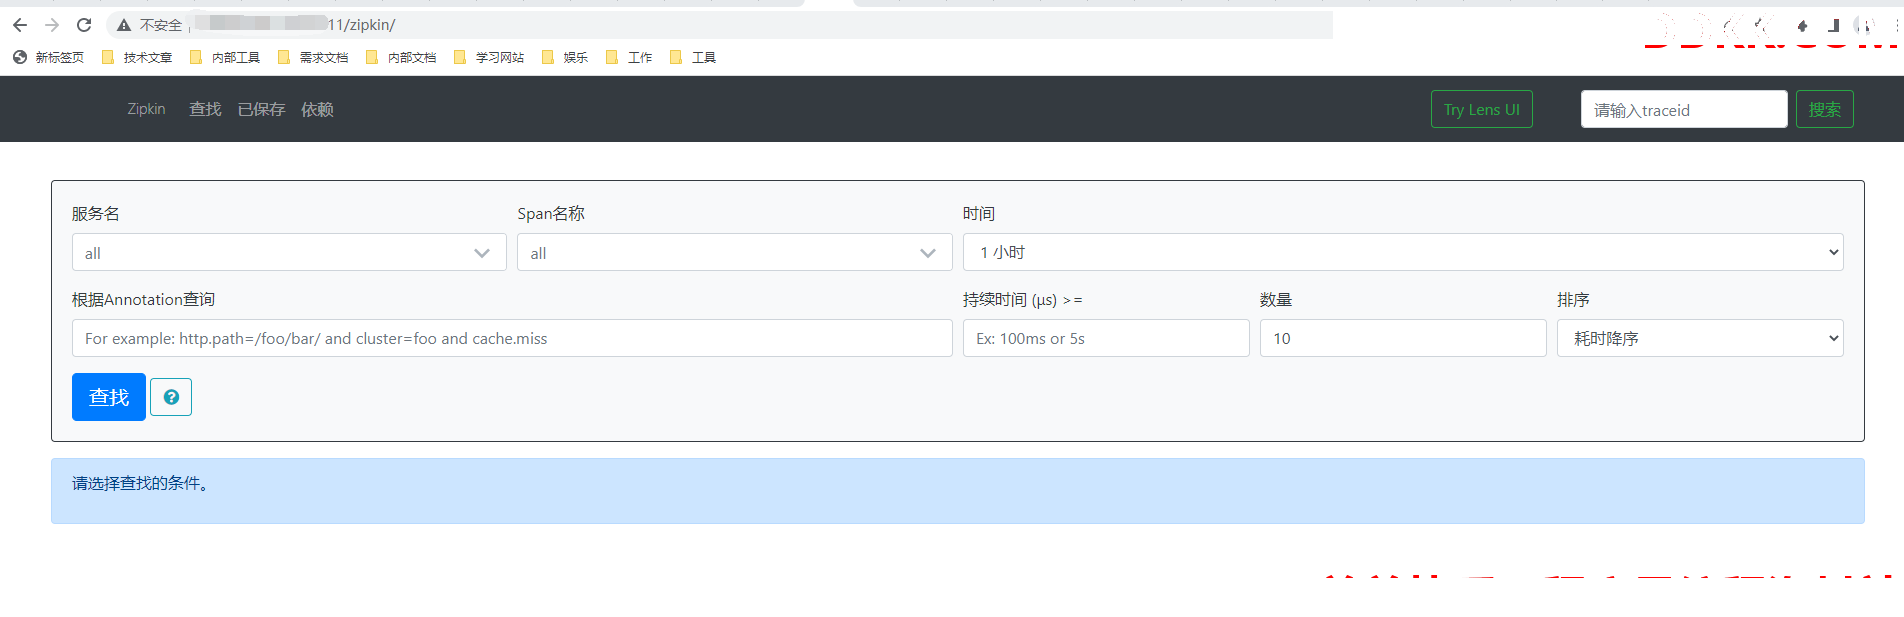
2.5.1 zipkin服务端
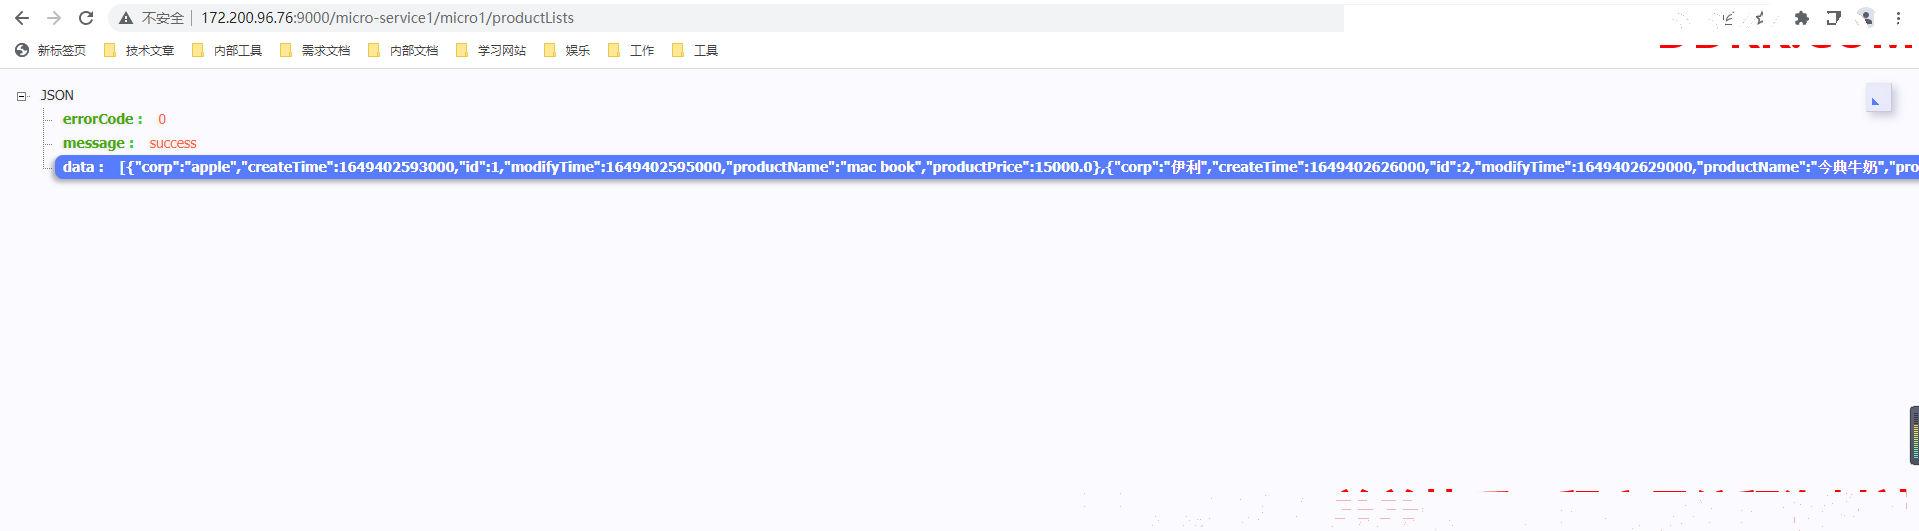
2.5.2 通过网关请求数据
2.5.3 针对上述请求zipkin链路追踪信息
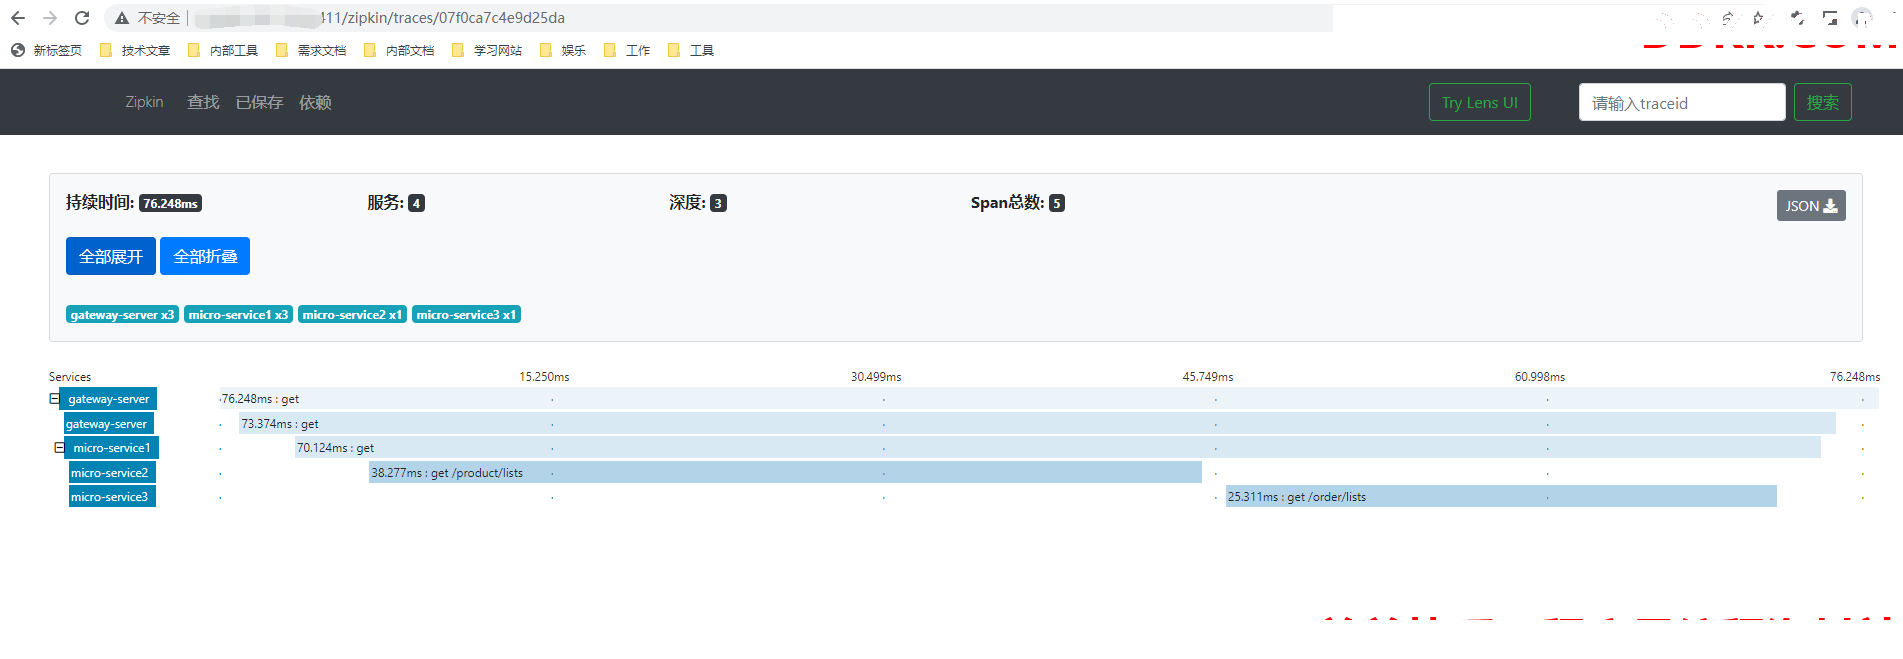
服务之间依赖关系:
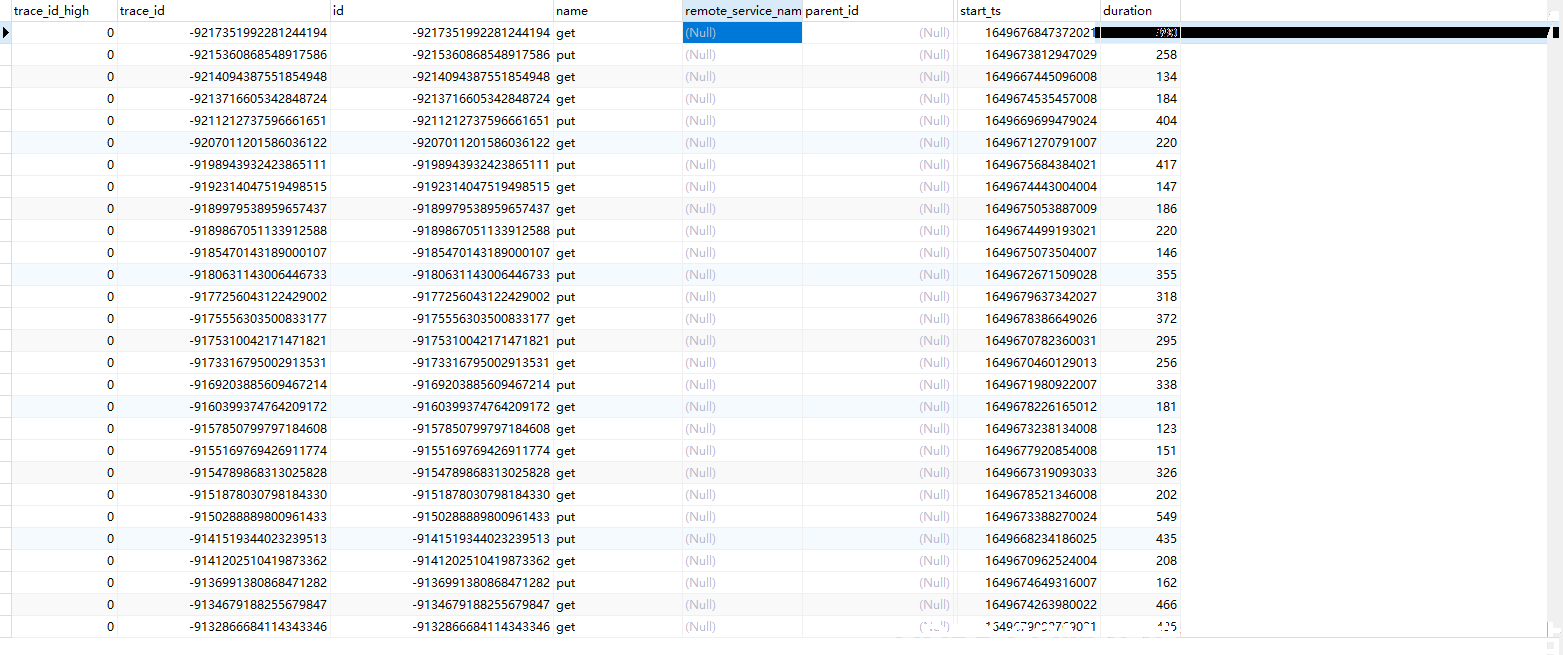
2.5.4 MySQL记录的数据
3.小结
1、 链路追踪是展示微服务之间调用关系的重要手段,在展示服务之间关系、查询调用请求异常中有着至关重要的作用;
2、 本文主要展示了sleuth追踪服务的原理,以及zipkin展示数据的原理,同时编写了demo,通过http请求收集链路追踪数据并展示;
3、 本文缺陷之处在于未展示利用Kafka等中间件收集数据、未展示消息存储到ElasticSearch平台下文将展示利用Kafka收集、;
ElasticSearch展示链路追踪数据。
4.参考文献
1、 https://www.jianshu.com/p/aab7c9db83dc;
2、 https://www.bilibili.com/video/BV1DL4y1e7aY?p=11;
3、 https://zipkin.io/pages/quickstart.html;
4、 https://docs.spring.io/spring-boot/docs;
5.附录
项目地址:
1.https://gitee.com/Marinc/spring-boot-sleuth-zipkin.git